
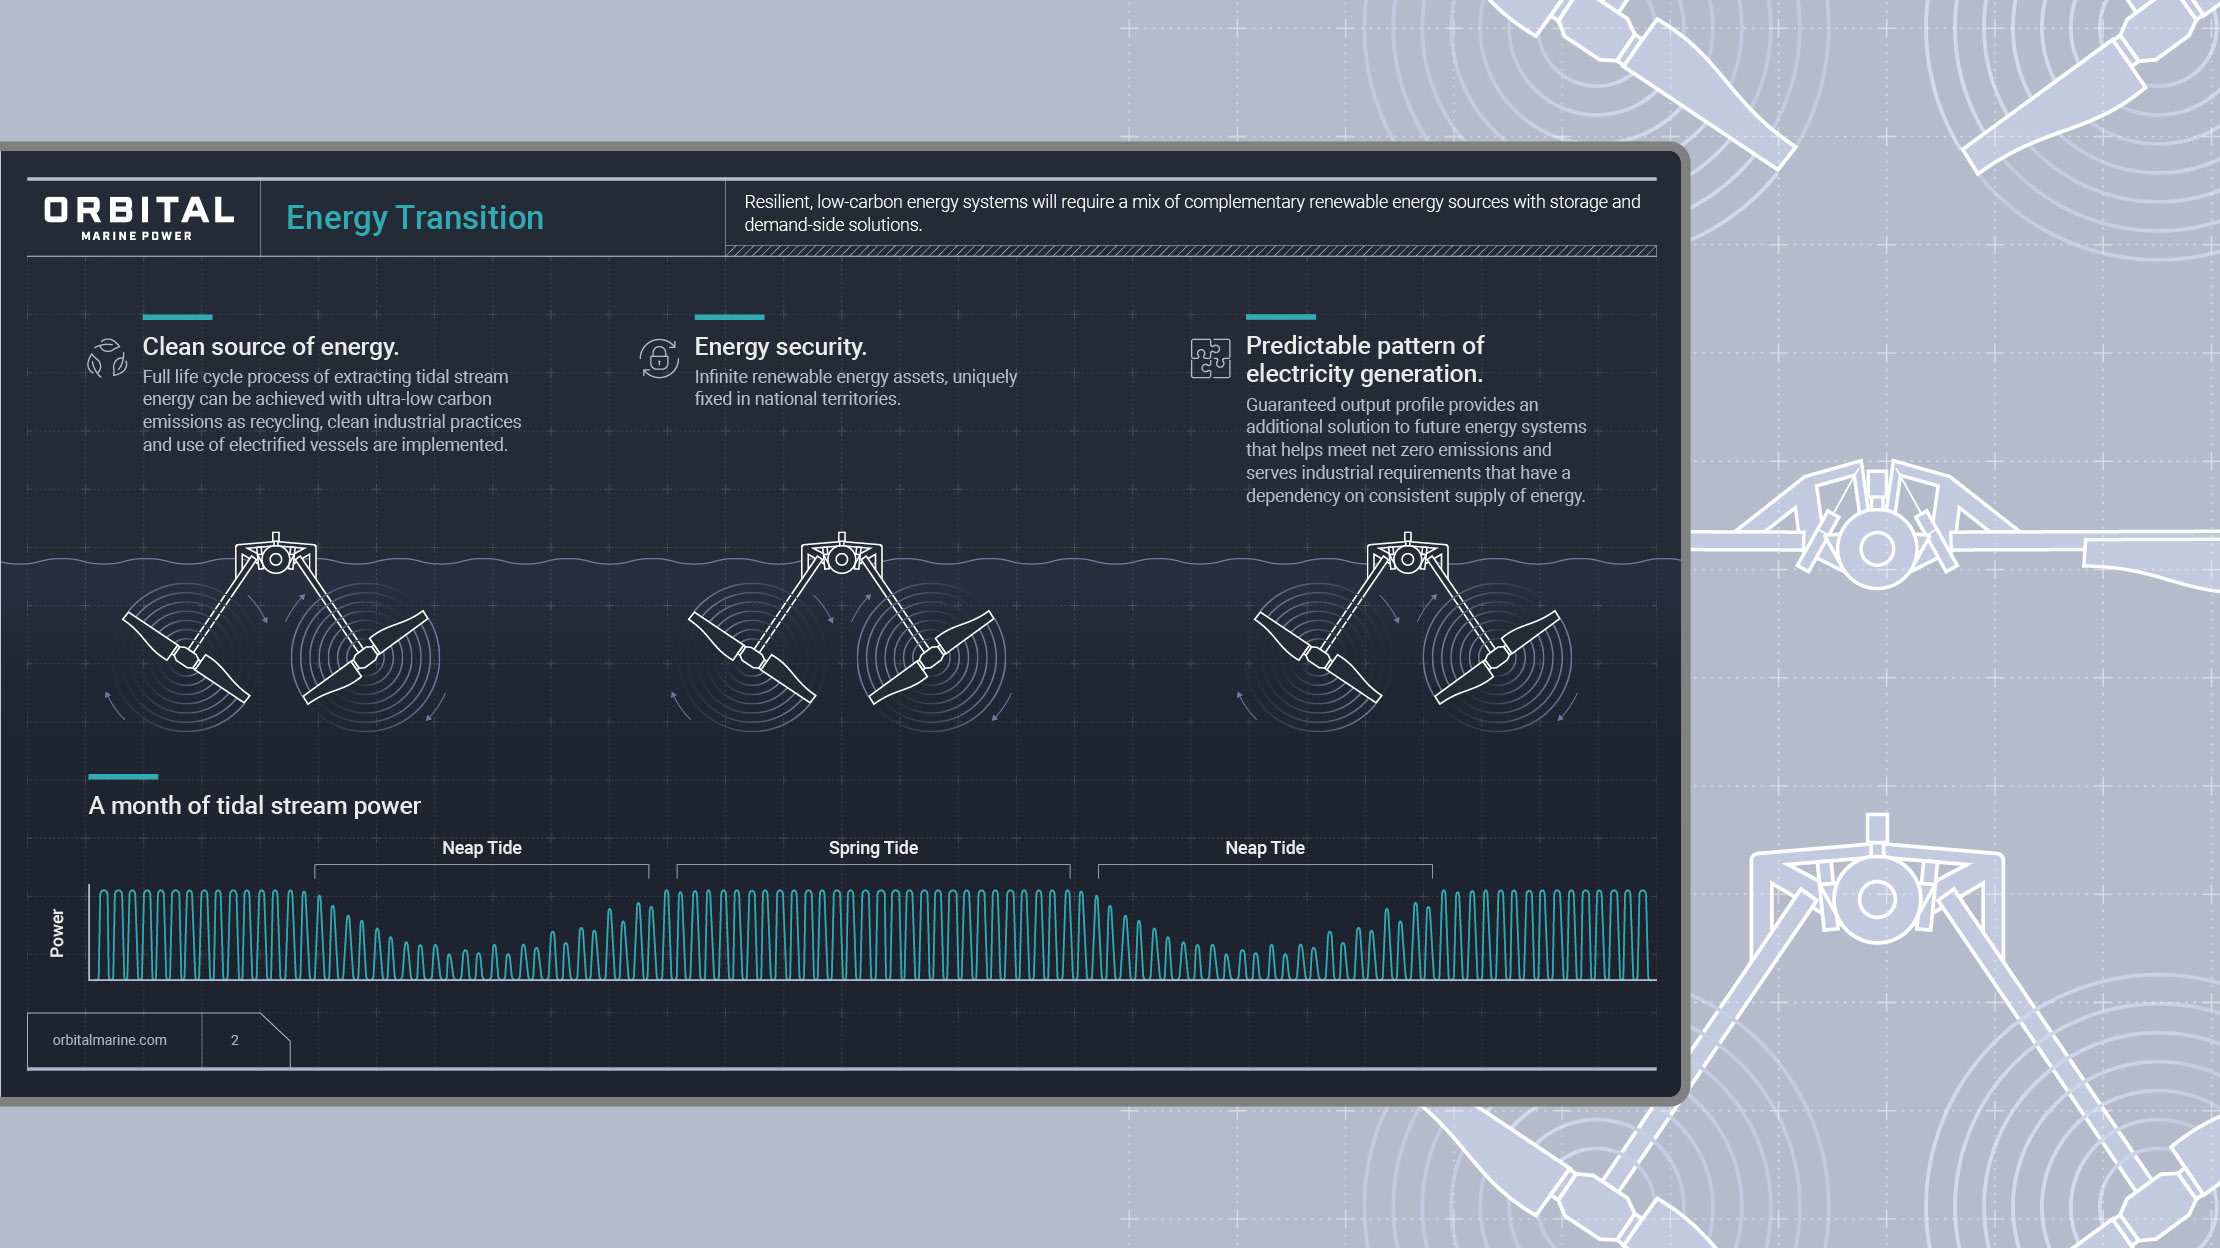
Orbital Marine Power
Illustrations + Infographic design + Word and PowerPoint template design
Let's work together
+44 (0) 131 510 8260
Please call +44 (0) 131 510 8260 for more information on any of our creative services.

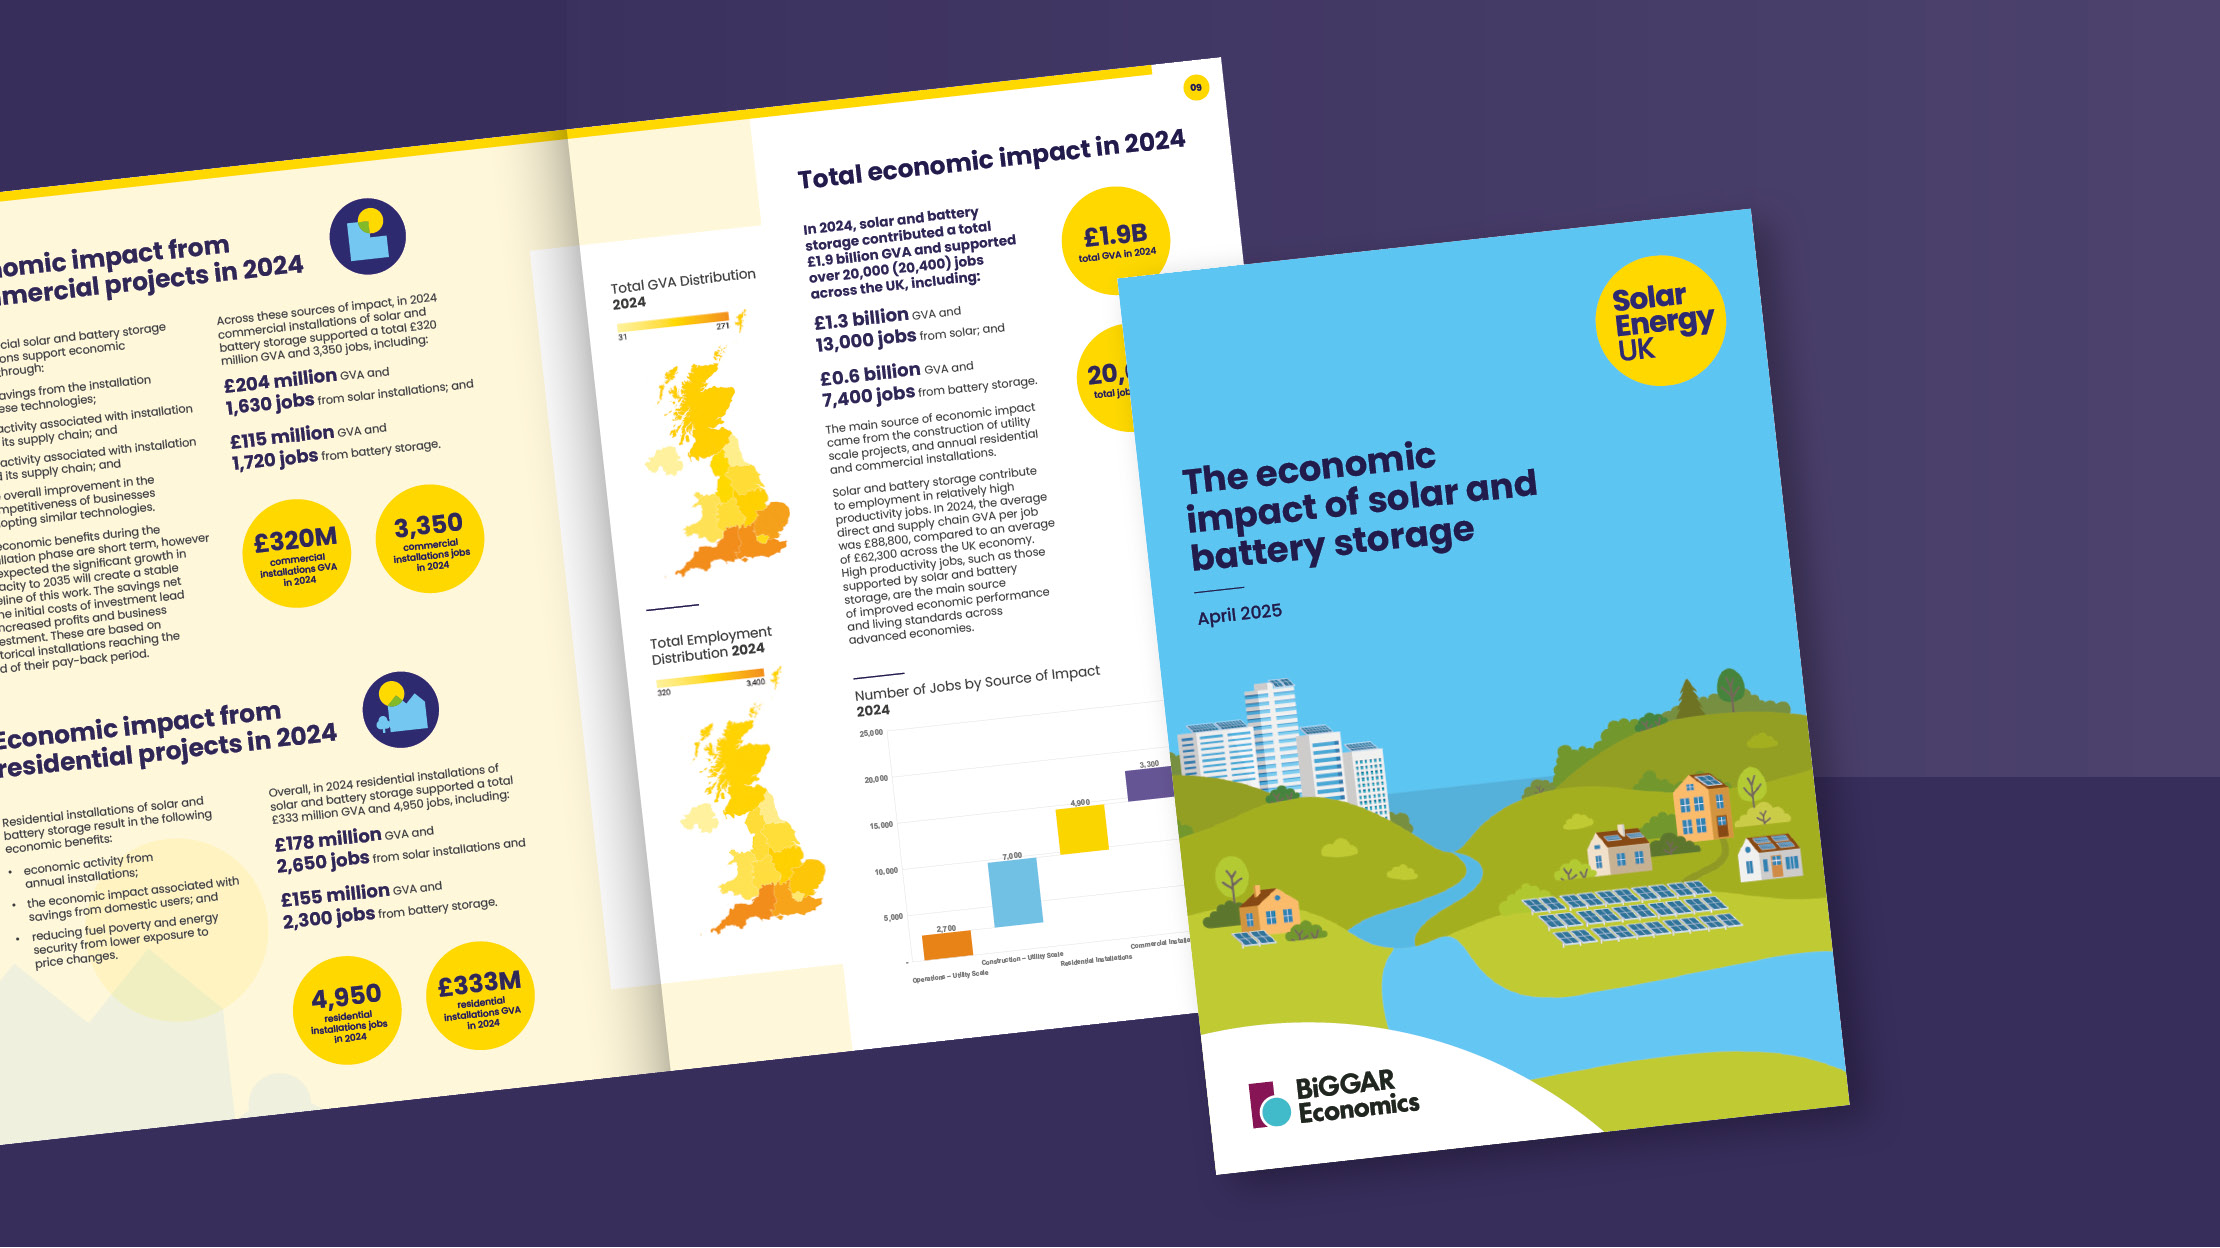
With 400+ member companies represented across the UK energy sector, Solar Energy UK’s research, policy work and advocacy shape regulation and drive market growth.
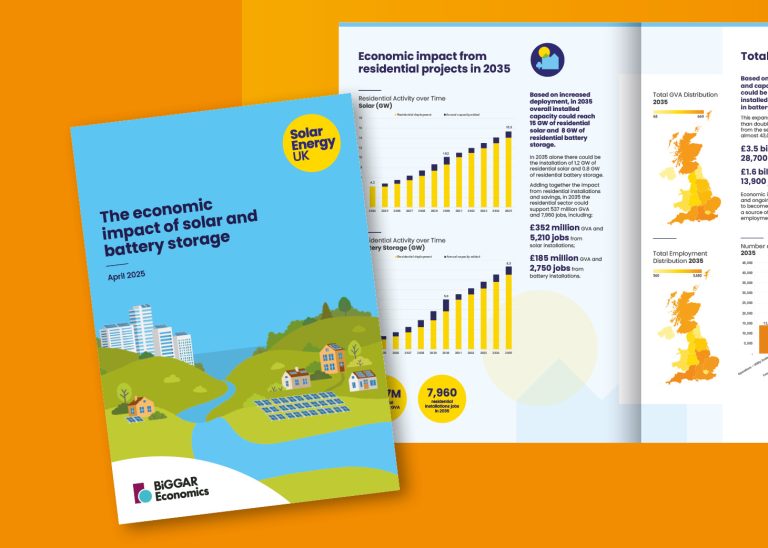
Firefly was commissioned by Biggar Economics to convey the findings of a major study conducted for Solar Energy UK on the the economic impact of solar and battery storage. The challenge was to present detailed research through clear, visually compelling communications in the form of a report and infographics.
Caption here
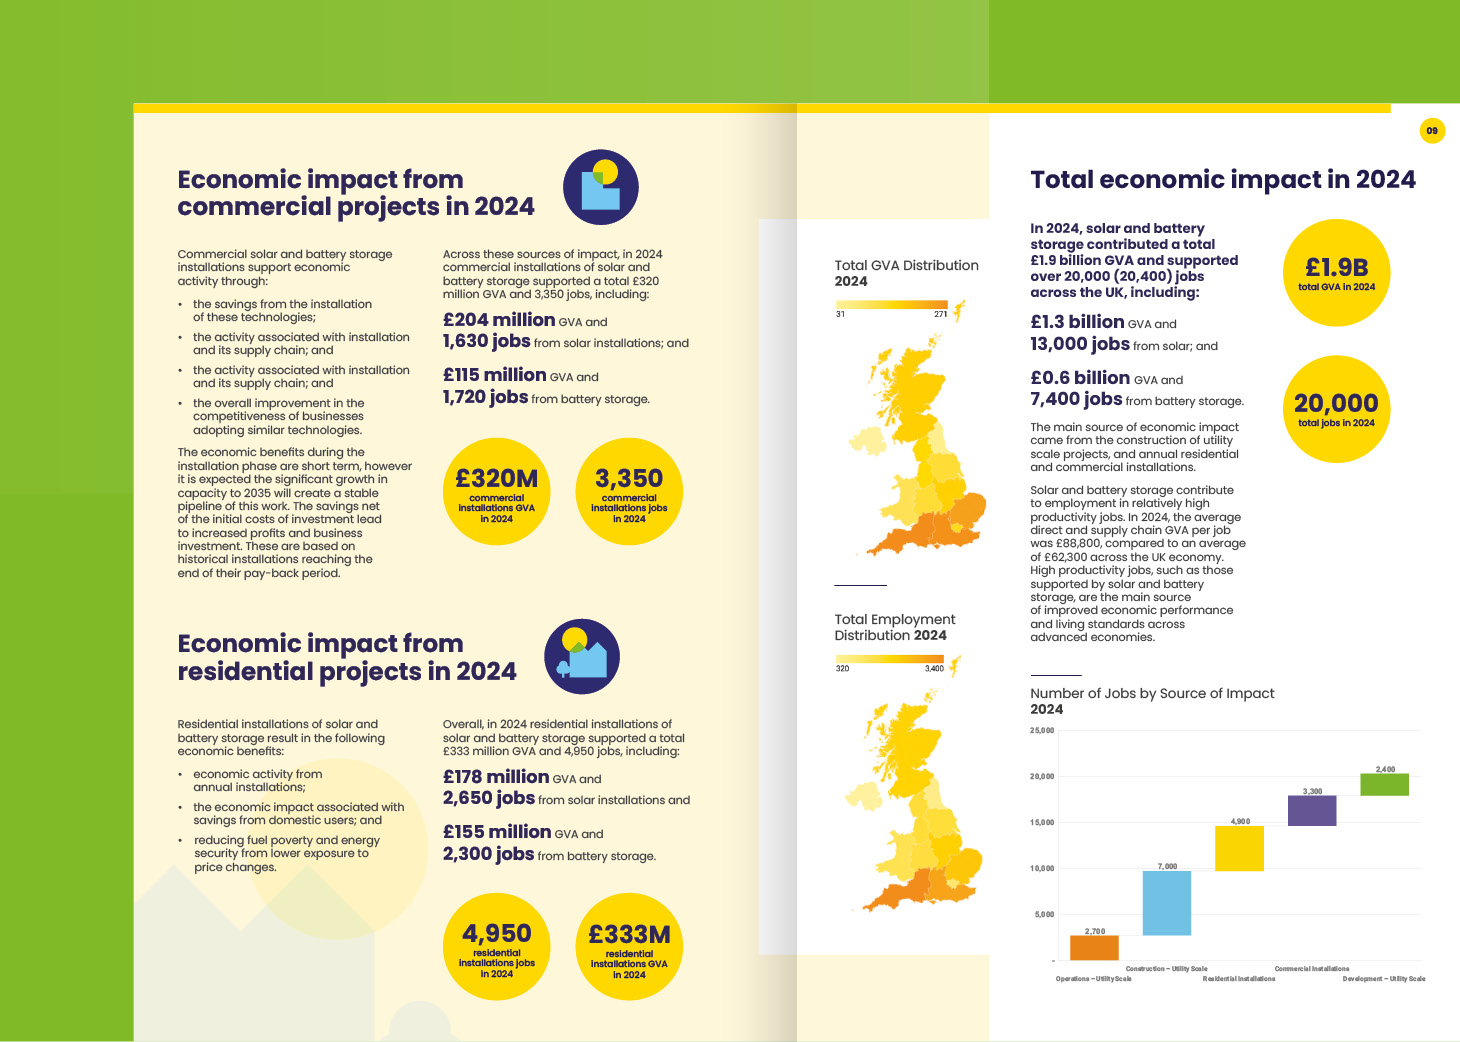
We collaborated to transform the study’s findings into a suite of engaging and user-friendly materials. This included a detailed report featuring various graphs, charts and statistics along with a series of infographics which were printed and handed out during their conferences.
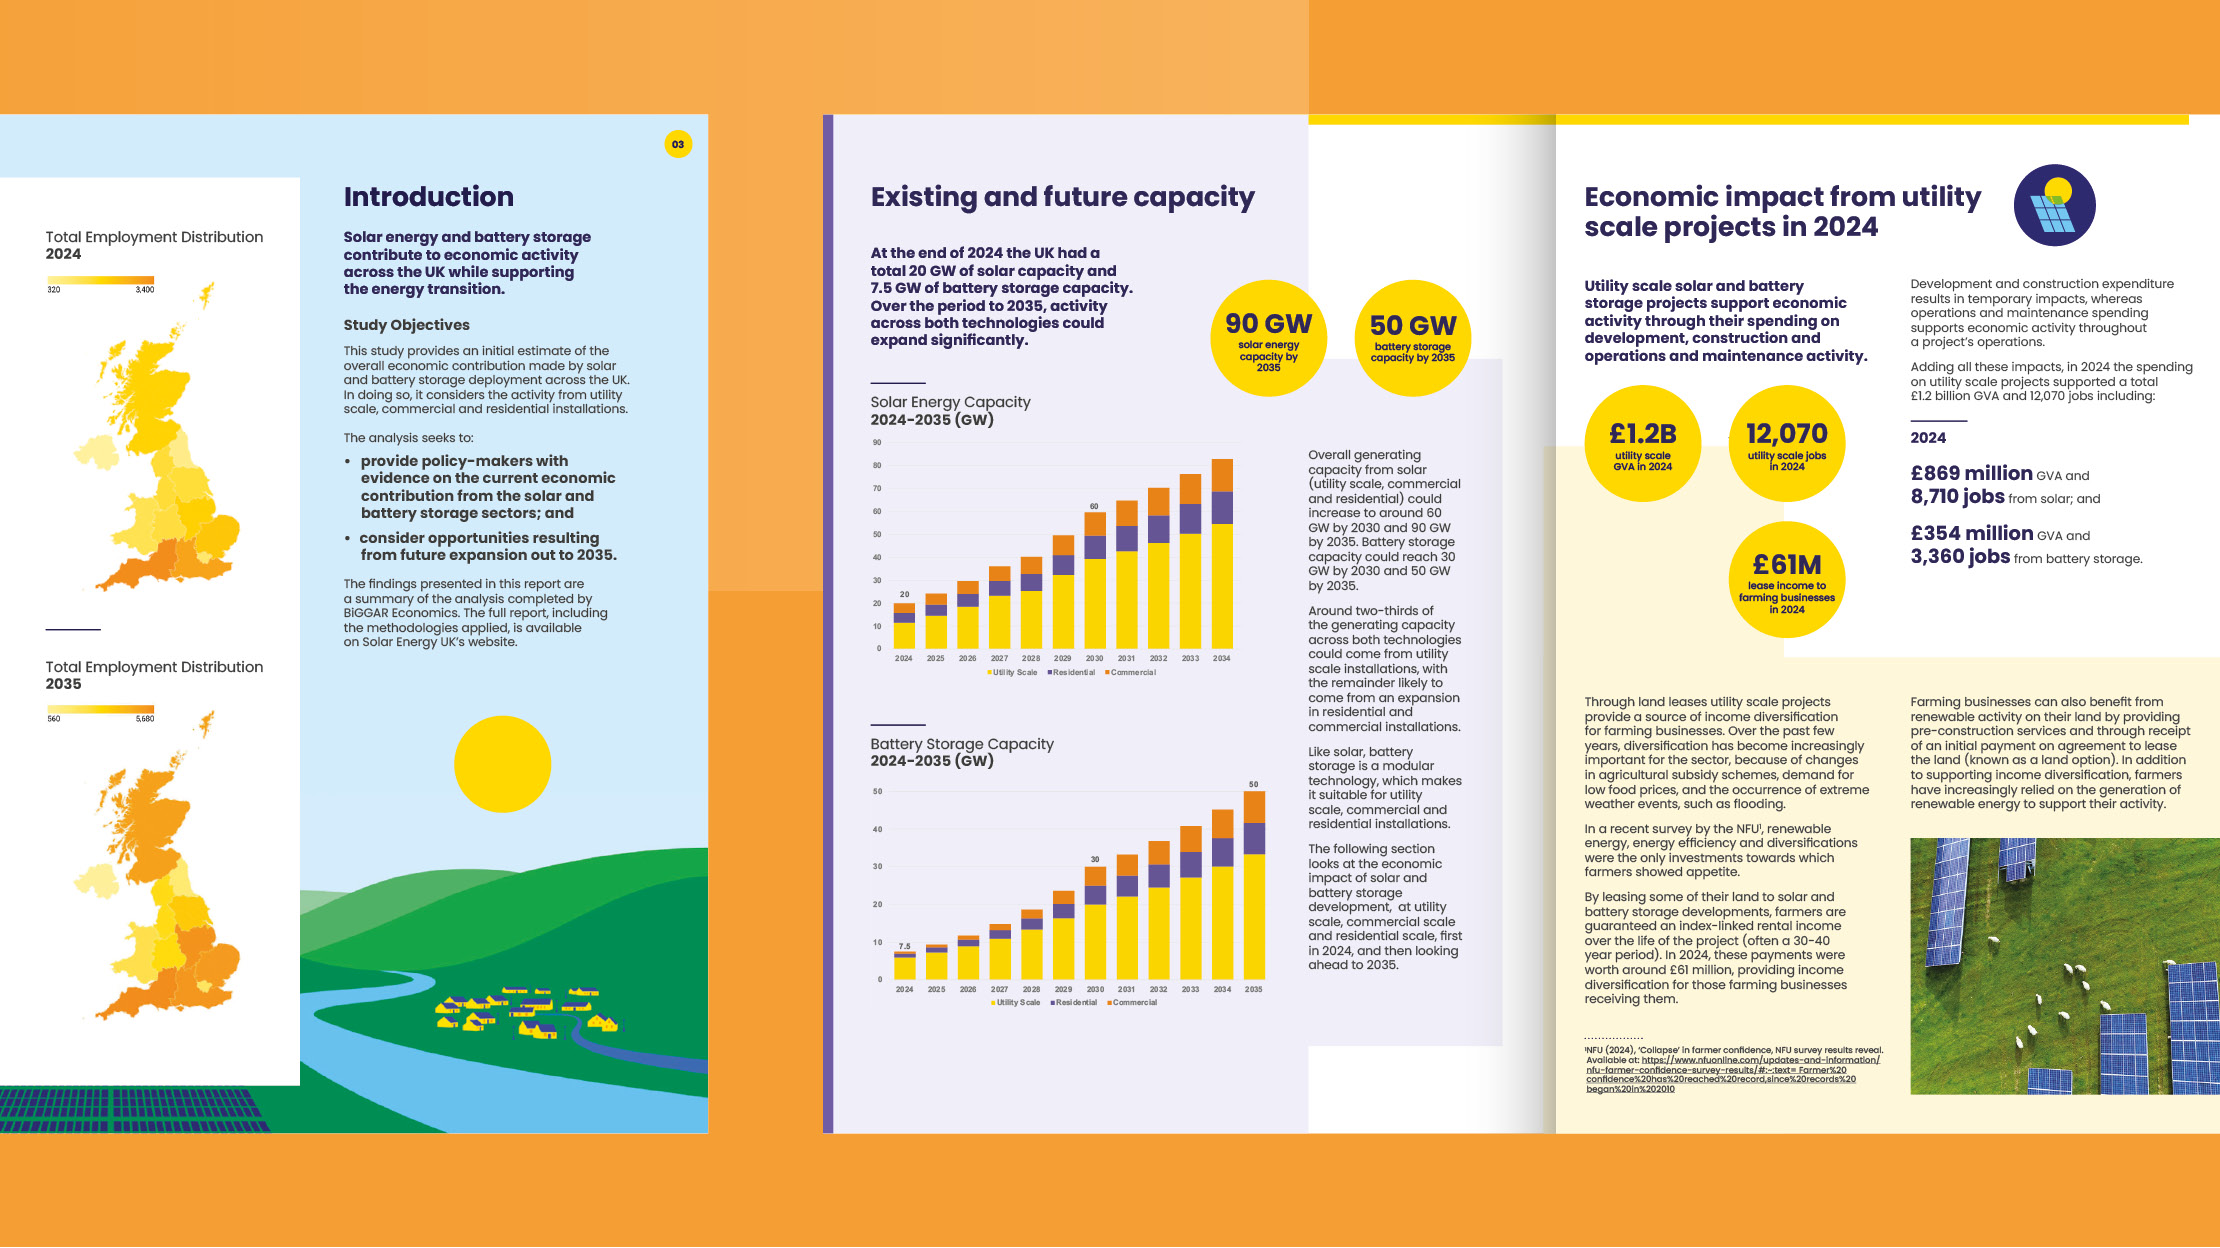
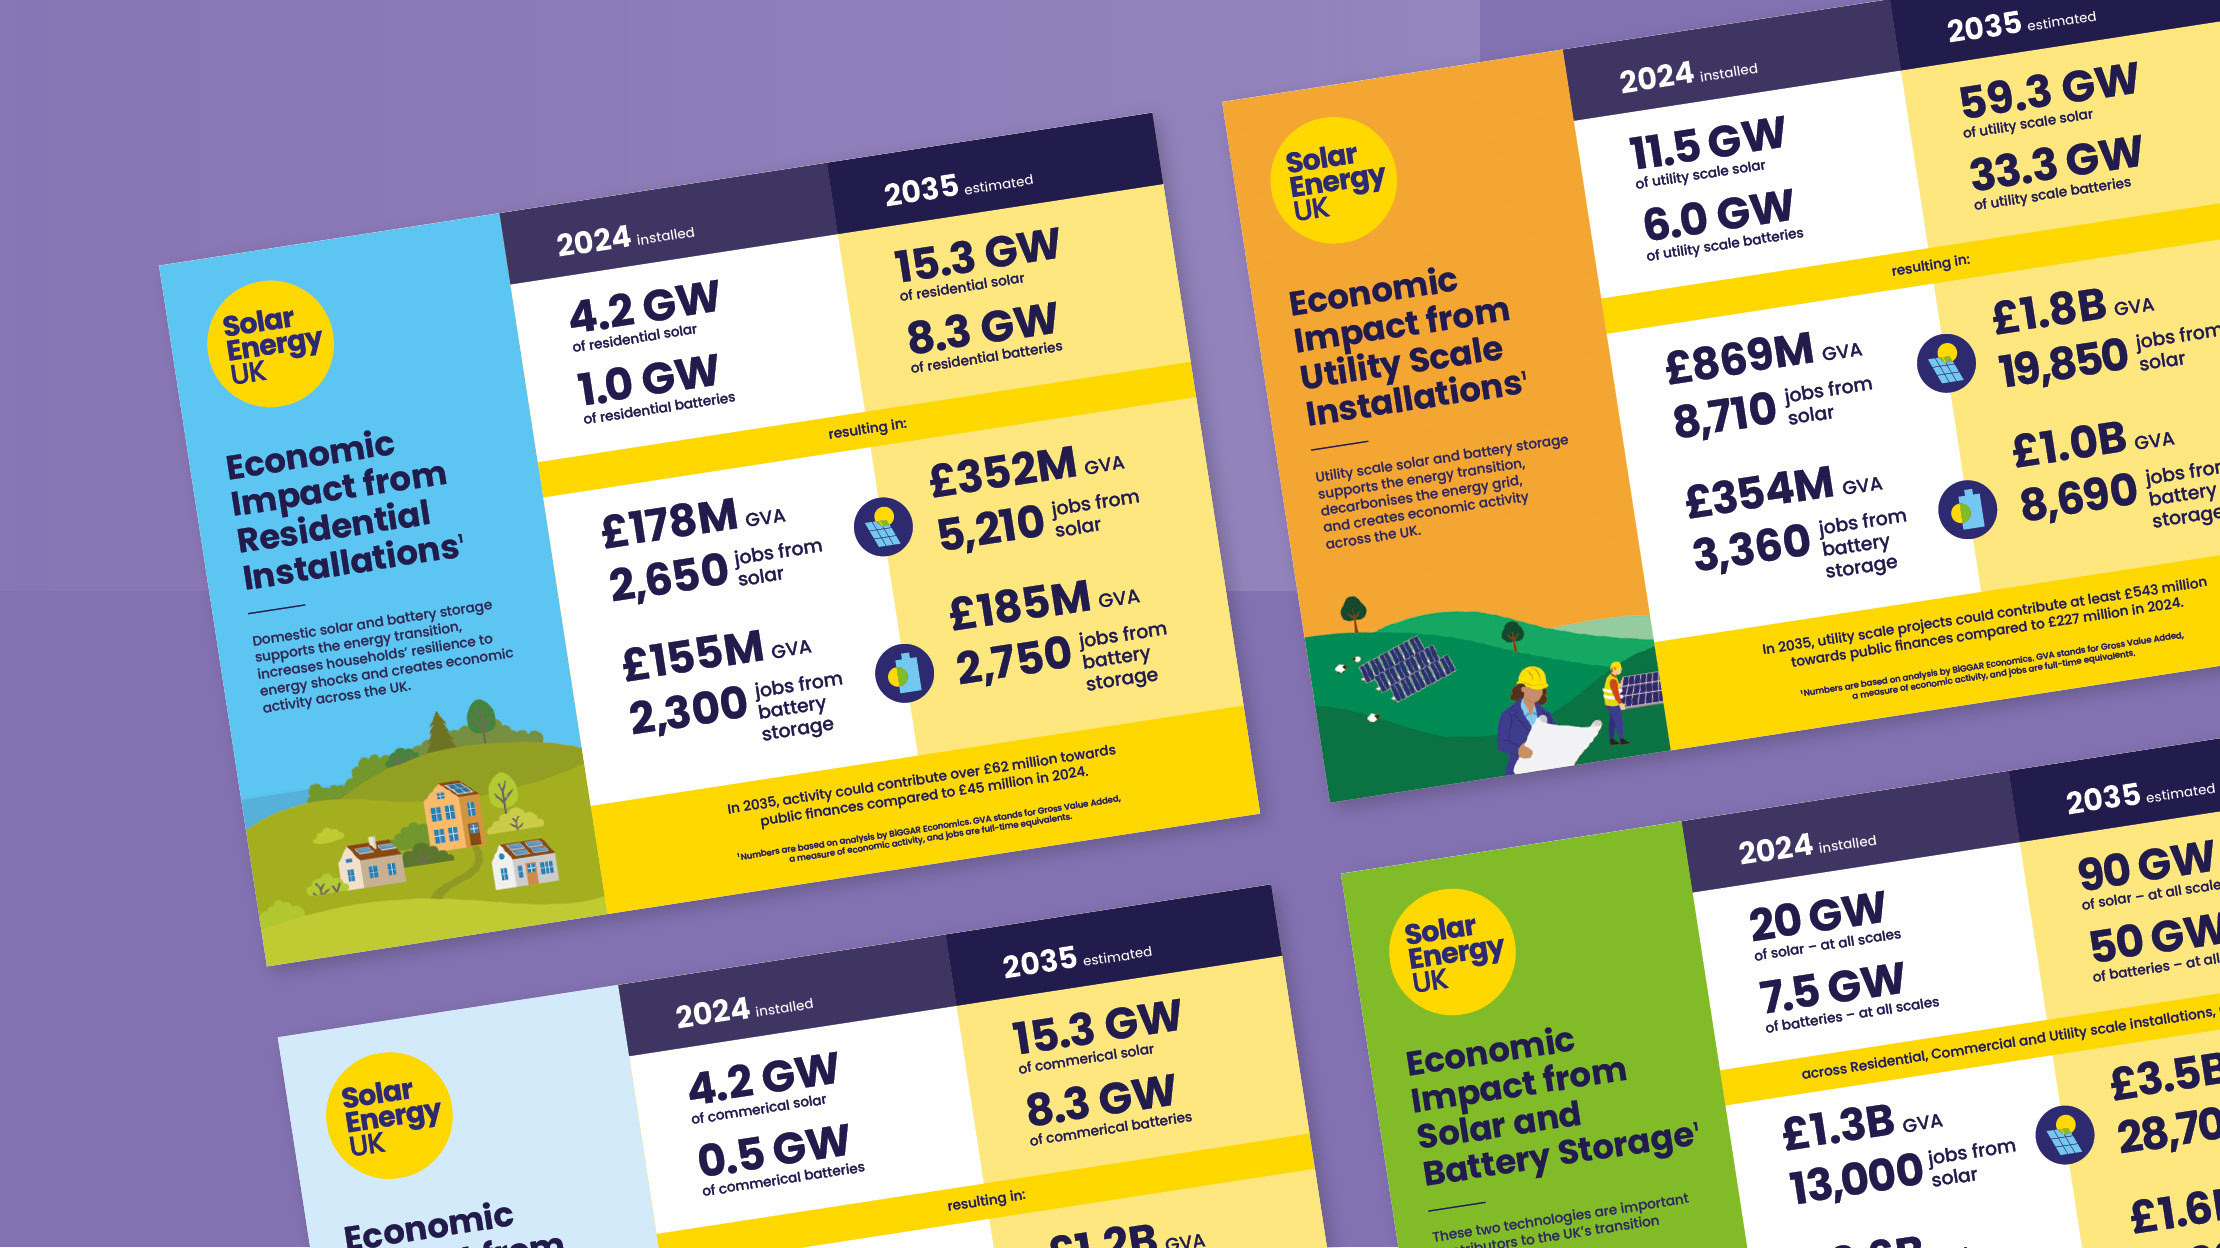
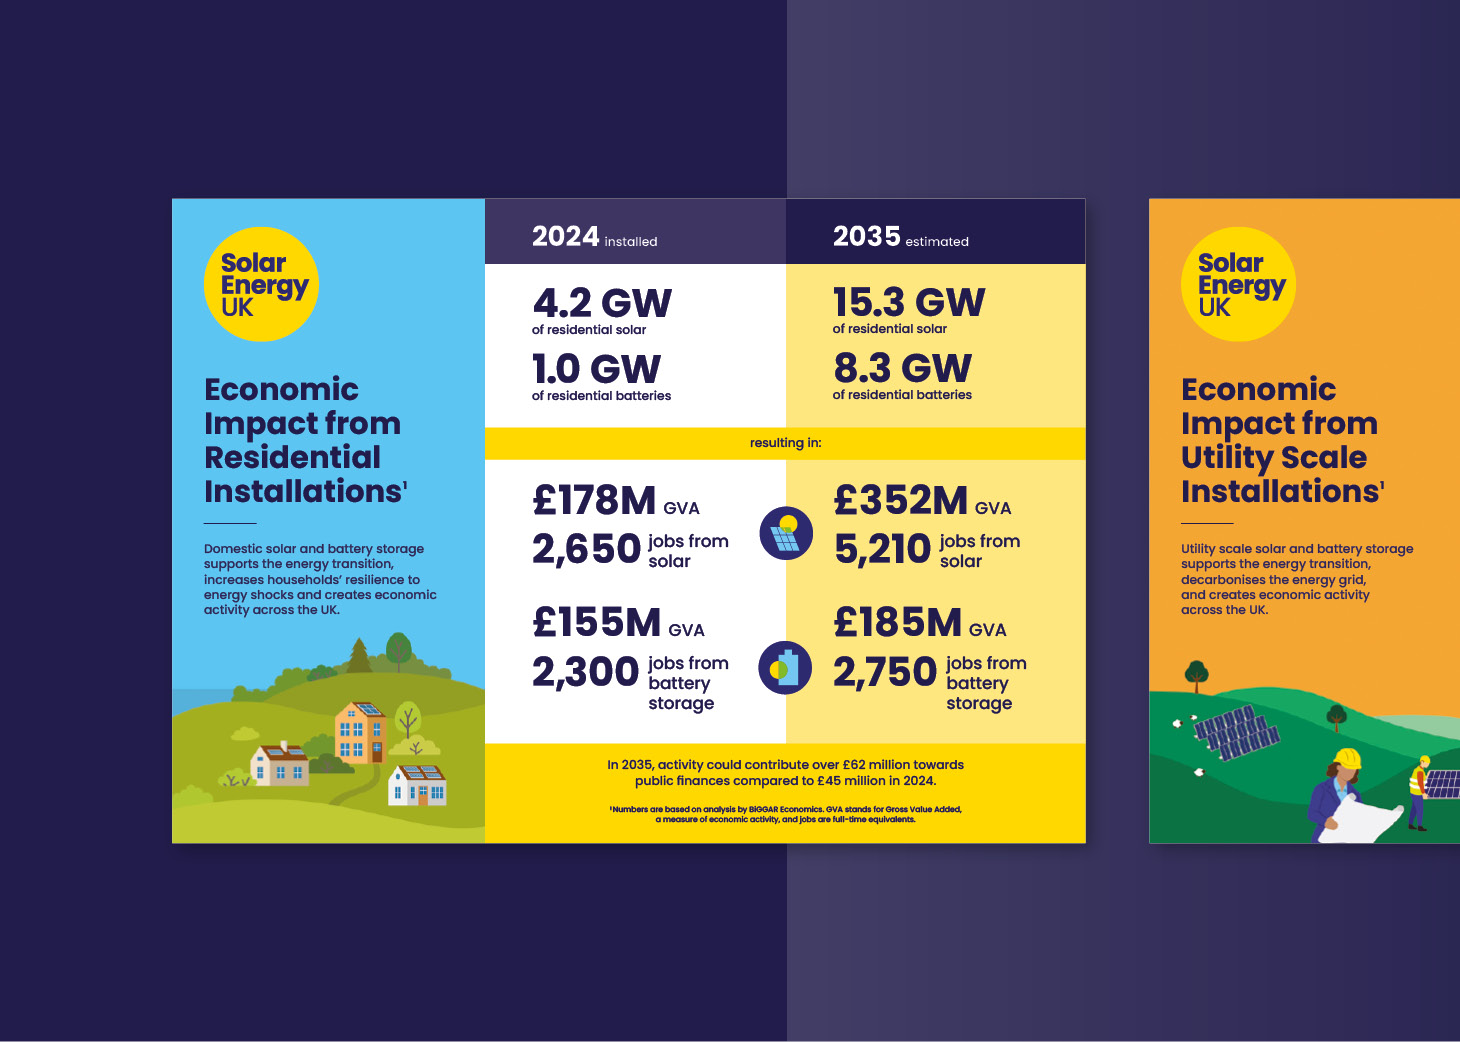
We worked within Solar Energy UK’s established visual language, leveraging their existing brand assets, including their iconography and zingy colour palette, to ensure consistency and cohesion across all formats. Their high-contrast palette was used to theme the different sections of the report with iconography helping to differentiate between various industries such as Commercial, Utility and Residential. This helped make the information-heavy report more engaging and digestible for the reader.
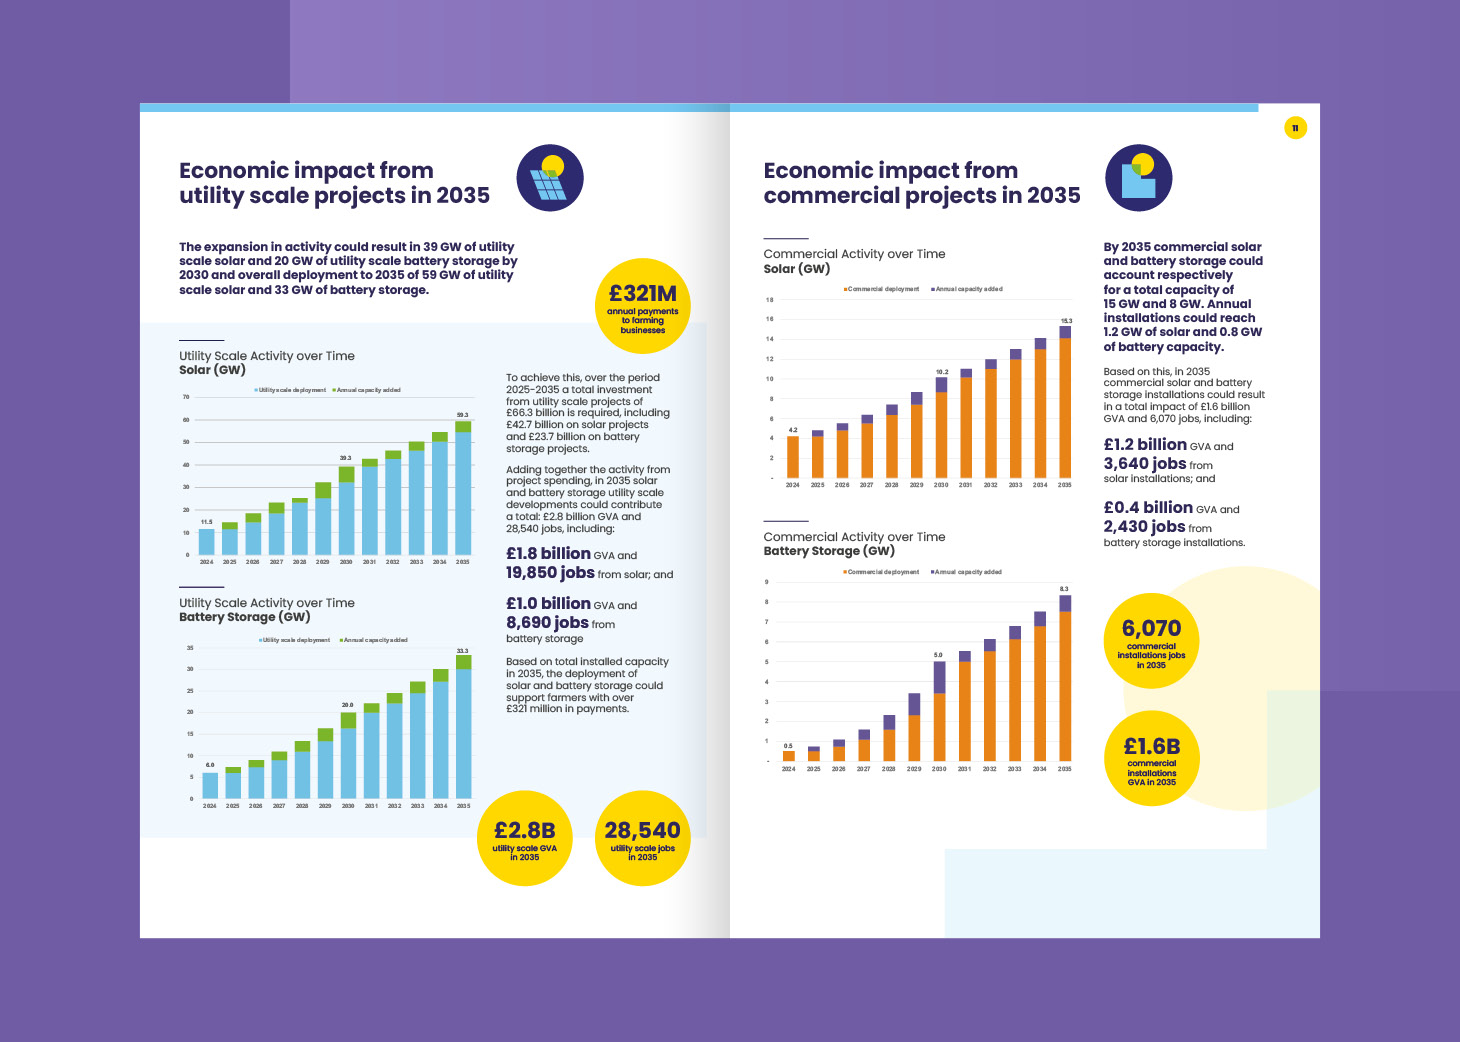
Accessibility was a core consideration throughout the project. We ensured a strong contrast between text and background colours and maintained a consistent structural framework to support ease of reading. A clear typographic hierarchy guided the eye through varying levels of information, while carefully crafted layouts made dense data more digestible.
Infographics were adapted to highlight the impact of solar and battery storage on specific industries, again, using colour to separate them into themes. These number-focused infographics needed to show the increase in solar and battery storage while highlighting the positive impact this is predicted to have on jobs by 2035. It was crucial that this impact was emphasised and the figures were easy to read.
Success! We've received your message and will get back to you as soon as possible. We look forward to chatting to you.

“Firefly was a pleasure to work with throughout our project.
It was clear from the initial design discussions that their attention to detail, content suggestions and proposed structure would help us achieve the goals we had envisioned for our new brand and they did not disappoint. Thank you for making the process so simple.”
Adam Medley
Operations Manager
Insight Software Development